
ABSTRACT
India’s formal credit market across seven high-impact sectors has grown fourfold over the past ten years, from ₹21 lakh crore in 2015 to ₹82 lakh crore in 2025, and is estimated to grow a further 3x over the next ten years, reaching approximately ₹225 lakh crore by 2035. The seven sectors are MSME finance, microfinance, affordable housing, agritech, renewable energy, e-mobility and education finance. This expansion reflects the strength of what government policy and private sector investment have built together. The Jan Dhan programme, Aadhaar-linked identity and UPI brought hundreds of millions of households and enterprises into the formal financial system. Mudra, CGTMSE and Priority Sector Lending mandates directed credit toward individual borrowers and MSMEs at scale; the Mudra programme alone has disbursed over ₹32 lakh crore across more than 52 crore loan accounts since 2015. The Digital India stack created a data infrastructure, comprising GST returns, UPI transaction histories and Account Aggregator consent, that is expanding the reach and economics of formal credit at a pace that continues to accelerate. India’s credit-to-GDP ratio stands at 57% today, against 126% in Vietnam, 101% in the Eurozone and 214% in the United States. The headroom this represents, set against the infrastructure already in place, defines the scale of what this market can become.
Demand is outpacing supply across all seven sectors. The three largest drive the majority of today’s ₹60 lakh crore opportunity: MSME finance, with ₹18.4 lakh crore in formal supply serving estimated demand of ₹43.5 lakh crore; microfinance, at ₹11.2 lakh crore, with 6.5 crore active borrowers and the borrower base expanding steadily; and affordable housing, at ₹12.2 lakh crore, supported by a documented housing requirement of 19 million units concentrated in secondary and tertiary cities.
The four remaining sectors carry the highest forward growth rates. Renewable energy and e-mobility are driven by India’s 500 GW clean energy target and fleet electrification crossing the total cost of ownership threshold. Agritech credit is expanding on the back of satellite-enabled crop monitoring and digital supply chain data from platforms such as eNAM. Education finance is growing with rising enrolment in vocational and professional programmes. Four structural forces accelerate all seven simultaneously: urbanisation adding 100 million people to India’s cities by 2036, the energy transition, rising household investment in education and shelter, and a digital data infrastructure that is reducing the cost of small-ticket underwriting at a pace that continues to accelerate.
The opportunity this creates is open to coordinated participation across the credit ecosystem. The wholesale fundable layer, being credit deployed through regulated NBFC intermediaries of sufficient scale to access institutional capital, has compounded at 16% annually over the past decade, sustaining that trajectory through every major market event the period presented, and is projected to reach ₹14.1 trillion by 2035. For public institutions, private lenders and international capital providers, the infrastructure is in place, the demand is proven and growing, and the decade ahead presents a generational opportunity to scale credit at a pace India’s financial inclusion drive has made possible.
KEY FINDINGS
- Among India’s high-potential impact credit sectors, seven key sectors represented an addressable credit opportunity of approximately ₹82 lakh crore in 2025, projected to grow 3x over the next ten years, reaching ₹225 lakh crore by 2030.
- The wholesale NBFC fundable layer has grown at 16% per annum over the past decade, through demonetisation, the IL&FS contagion, the pandemic moratorium, and the 2024-25 sector correction.
- India’s credit-to-GDP ratio of 57% compares with 126% for Vietnam and 214% for the United States, indicating substantial structural headroom.
- The MSME credit gap alone is estimated at ₹25.1 lakh crore, the largest single component of the seven-sector opportunity.
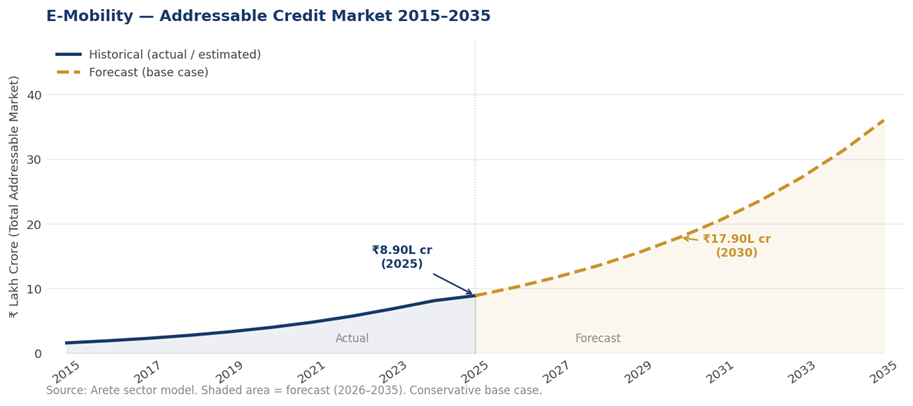
- E-mobility carries one of the highest forward growth rates, scaling from ₹1.5 lakh crore in formal credit supply today to a projected ₹5-8 lakh crore by 2030, driven by fleet electrification in commercial two- and three-wheeler categories crossing the total-cost-of-ownership viability threshold.
Keywords: impact credit, India, MSME finance, microfinance, renewable energy, e-mobility, agritech, education finance, affordable housing, financial inclusion, credit gap, NBFC, development finance
INDIA’S CREDIT EXPANSION AND THE GAP THAT REMAINS
India’s credit-to-GDP ratio of approximately 57% reflects both significant progress in deepening financial reach and substantial remaining headroom relative to global peers. The United States operates at around 214%, the Eurozone at 101%, and Vietnam (an emerging market comparator) at 126%. China stands at 185%, though that figure reflects decades of state-directed credit allocation that India has deliberately not replicated, for sound financial stability reasons.
Table 1: Credit-to-GDP Ratio, Selected Economies (latest available year)
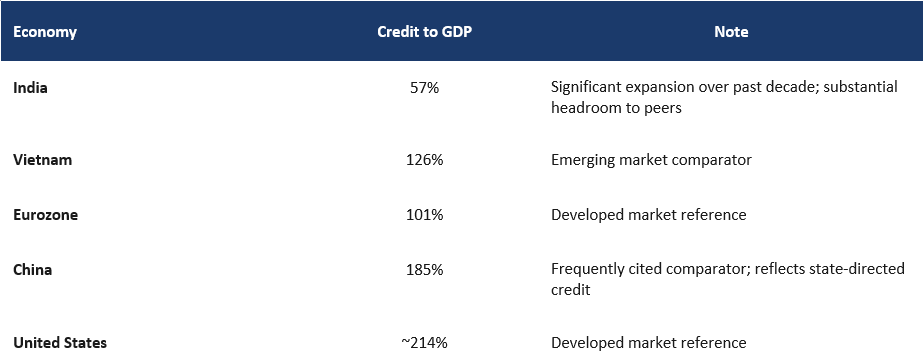
Source: World Bank Global Financial Development Database 2024; BIS Credit Statistics. Credit to GDP refers to domestic credit to the private sector as defined by the World Bank GFDD, excluding credit to the government sector.
The foundations of India’s financial inclusion drive are well established. The Digital India stack (Aadhaar-linked identity, Jan Dhan accounts and the rapid scaling of UPI) has brought millions of individuals and enterprises into the formal financial ecosystem. The Business Correspondent network extended the physical reach of financial services to geographies that formal institutions had not previously served. The Pradhan Mantri Mudra Yojana has, since 2015, disbursed over ₹32 lakh crore across more than 52 crore loan accounts, meaningfully expanding formal credit access to the bottom of the pyramid. The Credit Guarantee Fund Trust for Micro and Small Enterprises has removed collateral barriers that previously excluded a large share of small enterprise borrowers.
The scale of the credit opportunity alongside this progress reflects the arithmetic of demand: the underlying demand across these sectors is so large and growing so fast that even substantial absolute expansion in credit access leaves significant room for further supply. What these sectors require is credit infrastructure built for the economics of small-ticket, sector-specialised origination at the pace and geography these markets demand. India’s incumbent financial institutions were designed for a different credit market – ones with bank rating frameworks built around corporate borrowers with audited balance sheets, tangible collateral and credit histories that fit standard scoring models. The institutions best positioned to serve these borrowers sit outside the banking system, and they have spent two decades building the local knowledge and sector-specific underwriting capability that centralised bank functions struggle to replicate at the required scale.
What is changing, and changing at a pace not anticipated even five years ago, is the data infrastructure available to those institutions. Over 1.5 crore enterprises hold active GST registrations as of 2025. Every GST return is a real-time cash flow statement. UPI transaction histories function as behavioural proxies for creditworthiness. The Account Aggregator framework reduces financial history retrieval from weeks to seconds. Satellite-based crop monitoring makes agricultural credit assessment possible without field visits. These are the product of deliberate policy architecture (the IndiaStack, the JAM trinity, ONDC, GeM) and they are arriving faster than the lending infrastructure to deploy against them.
THE FORCES BEHIND THE NUMBERS
Projecting credit demand growth is an exercise in identifying the economic forces that will generate it. In the case of India’s impact credit sectors, those forces are operating visibly and with a momentum that predates the current policy environment. Four deserve particular attention: each has implications across multiple sectors simultaneously.
Urbanisation and its credit consequences
India’s urban population is expected to reach 600 million by 2036 – a net addition of roughly 100 million people over a decade. Household formation in secondary and tertiary cities generates demand for affordable housing finance in markets where formal lenders are thin and land title documentation is often imperfect. Urban migration creates demand for microfinance and small enterprise credit among the peri-urban self-employed. Urban commercial activity feeds MSME credit demand for working capital, equipment finance and trade credit at ticket sizes that remain below the economic threshold of bank credit functions. Urbanisation feeds several credit markets at once.
The scale of the credit opportunity alongside this progress reflects the arithmetic of demand: the underlying demand across these sectors is so large and growing so fast that even substantial absolute expansion in credit access leaves significant room for further supply. What these sectors require is credit infrastructure built for the economics of small-ticket, sector-specialised origination at the pace and geography these markets demand. India’s incumbent financial institutions were designed for a different credit market – ones with bank rating frameworks built around corporate borrowers with audited balance sheets, tangible collateral and credit histories that fit standard scoring models. The institutions best positioned to serve these borrowers sit outside the banking system, and they have spent two decades building the local knowledge and sector-specific underwriting capability that centralised bank functions struggle to replicate at the required scale.
What is changing, and changing at a pace not anticipated even five years ago, is the data infrastructure available to those institutions. Over 1.5 crore enterprises hold active GST registrations as of 2025. Every GST return is a real-time cash flow statement. UPI transaction histories function as behavioural proxies for creditworthiness. The Account Aggregator framework reduces financial history retrieval from weeks to seconds. Satellite-based crop monitoring makes agricultural credit assessment possible without field visits. These are the product of deliberate policy architecture (the IndiaStack, the JAM trinity, ONDC, GeM) and they are arriving faster than the lending infrastructure to deploy against them.
The energy transition as a credit market
India’s 500 gigawatt renewable energy target is as much a financing problem as it is an engineering one. Utility-scale solar and wind projects access capital markets and DFI debt with relative ease. The distributed tier (rooftop solar, off-grid rural systems, EV charging infrastructure in tier-2 and tier-3 cities) is precisely where specialised NBFC lenders have a comparative advantage. The EV market compounds this: a fleet operator financing 50 auto-rickshaw conversions in Coimbatore does not fit a corporate lending template, but represents exactly the credit that purpose-built e-mobility lenders are beginning to serve at scale.
Data infrastructure as a supply-side enabler
The credit gap has persisted partly because of the cost of assessing small-ticket credits without collateral and documentation. That cost is falling faster in India than almost anywhere else, because of the density and quality of digital infrastructure built on the Jan Dhan, Aadhaar and UPI foundations. GST returns are real-time financial statements. UPI transaction histories are behavioural credit proxies. Account Aggregator consent enables financial data portability in seconds. Satellite crop monitoring is replacing field visits. None of this eliminates credit risk. What it does is reduce assessment cost to the level at which small-ticket lending in underserved sectors becomes commercially viable.
Household investment in human capital and shelter
Rising incomes in India’s lower-middle income segment are translating into increased household expenditure on education and housing – the two largest lifetime capital allocations for most households in this bracket. Education finance is growing with higher enrolment in vocational and professional programmes where the return on investment is demonstrable. Affordable housing credit demand is driven partly by the PMAY credit-linked subsidy scheme and partly by the basic arithmetic of household formation rates in cities that do not have enough formally titled, bank-financeable housing stock to meet them.
Taken together, these four forces explain why the seven sectors do not move in lockstep. Microfinance and MSME lending are sensitive to consumer credit cycles. Renewable energy and e-mobility are tied more closely to technology cost curves and policy frameworks. Agritech demand varies with monsoon outcomes and commodity prices. Affordable housing correlates with urban land markets and interest rate levels. Education finance responds to labour market conditions and enrolment trends. The chart below plots the seven sectors against two axes: historical compound growth from 2015 to 2025, and forward growth potential to 2030. Bubble size represents 2025 wholesale market scale.
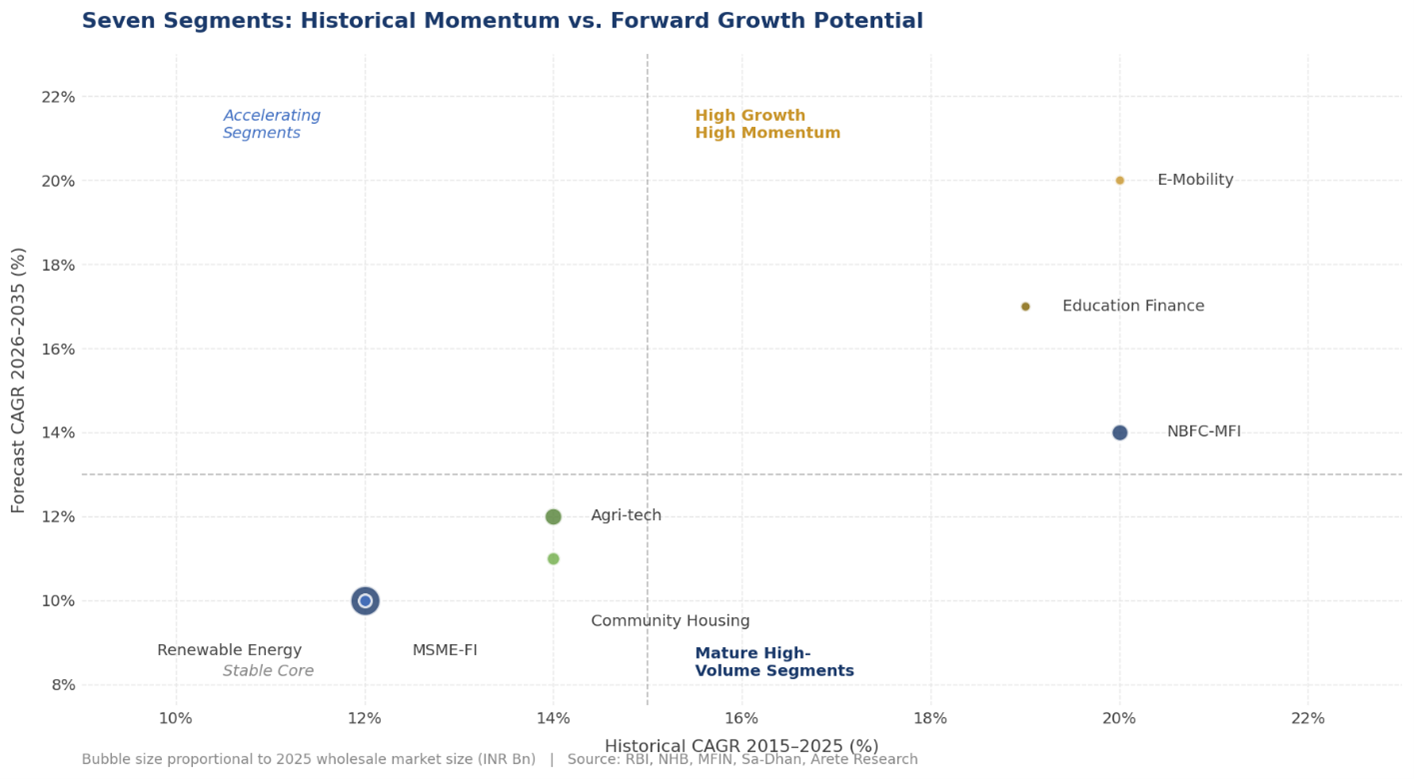
Exhibit 1: Seven Segments Mapped by Historical Momentum and Forward Growth Potential. Bubble size proportional to 2025 wholesale market size. Source: Arete Financial Partners sector model.
SEVEN SECTORS: SELECTION RATIONALE AND SECTOR ANALYSIS
The seven sectors were selected on explicit criteria. Each sits at the intersection of three defining conditions: a large and quantifiable gap between credit demand and formal supply; clear evidence of borrower repayment capacity grounded in observable cash flows or asset-backed economics; and the presence (or rapid emergence) of specialised lending institutions capable of serving these markets at scale. Sectors already well served by banks and large NBFCs were excluded on the grounds that credit infrastructure is relatively mature and structural supply gaps are limited. Early-stage climate technologies were excluded due to limited data visibility and the absence of scalable lending models.
Table 2: Addressable Credit Market by Sector, 2025 Estimates and 2030 Outlook
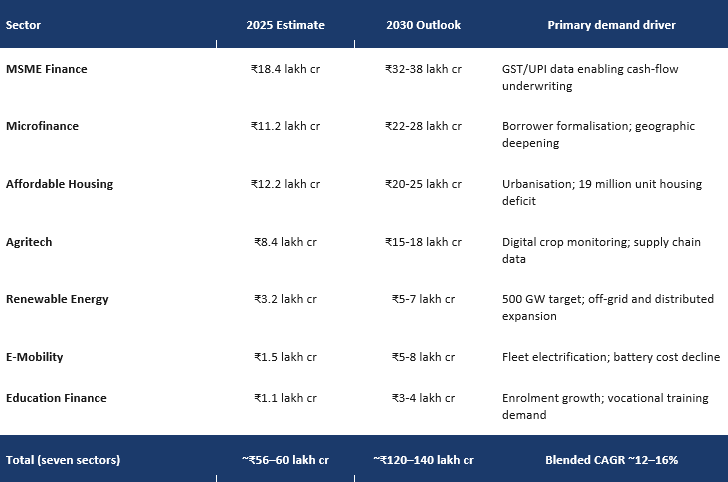
Sources: RBI Annual Report 2024–25; SIDBI MSME Pulse Q4 FY2025; MFIN Micrometer Q4 FY2025; NHB Annual Report 2024–25; MNRE Annual Report 2024-25; Arete estimates. Market sizes reflect addressable formal credit demand.
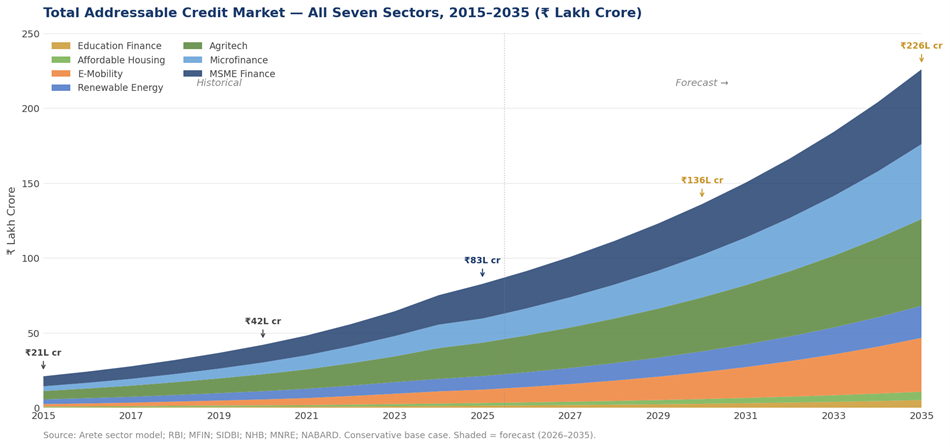
Exhibit 2: Total Addressable Credit Market – All Seven Sectors, 2015-2035 (₹ Lakh Crore). Source: Arete sector model; RBI; MFIN; SIDBI; NHB; MNRE; NABARD. Conservative base case.
1. MSME Finance
The IFC-SIDBI MSME Finance Gap Assessment of 2018 estimated a credit gap in excess of ₹25 lakh crore. Since that assessment, India has made meaningful progress: Mudra, CGTMSE, GST-linked cash flow lending, TReDS, OCEN framework development, and the growth of Small Finance Banks have all expanded access. Arete’s model updates the 2018 baseline for post-GST formalisation growth, TReDS and OCEN scale-up, and SFB sector expansion. The addressable market in 2025 is estimated at ₹18.4 lakh crore formal supply against an estimated demand of ₹43.5 lakh crore, with supply projected to grow to ₹32-38 lakh crore by 2030 as cash-flow-based underwriting scales.
Source: Arete sector model; SIDBI MSME Pulse Q4 FY2025; IFC-SIDBI MSME Finance Gap Assessment 2018.
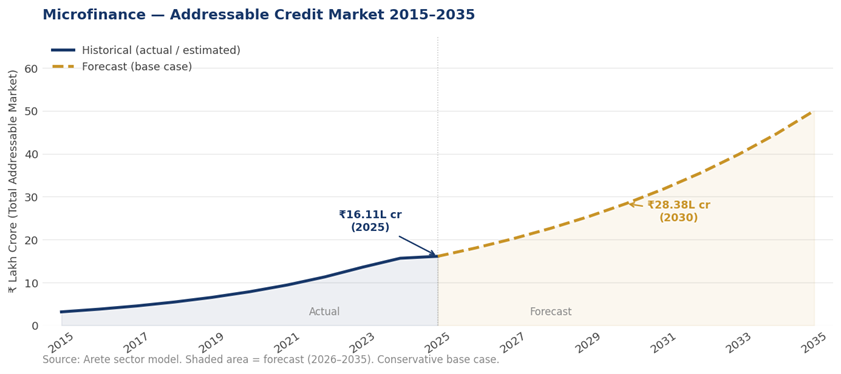
2. Microfinance
Microfinance is the most institutionally mature of the seven sectors. As of Q4 FY2025, India had approximately 6.5 crore unique active microfinance borrowers, with the broader sector serving over eight crore clients. The gross loan portfolio grew at a compound annual rate of approximately 20% between FY2020 and FY2024, driven in part by the digitalisation of lending and collections. The sector correction of 2024-25 caused gross loan portfolios to contract but did not arrest borrower base growth. The contraction reflected supply-side deleveraging by lenders who had over-concentrated in certain geographies, not a deterioration in underlying demand. A market where the borrower base grows while the loan book shrinks is exhibiting supply constraint, not demand exhaustion.
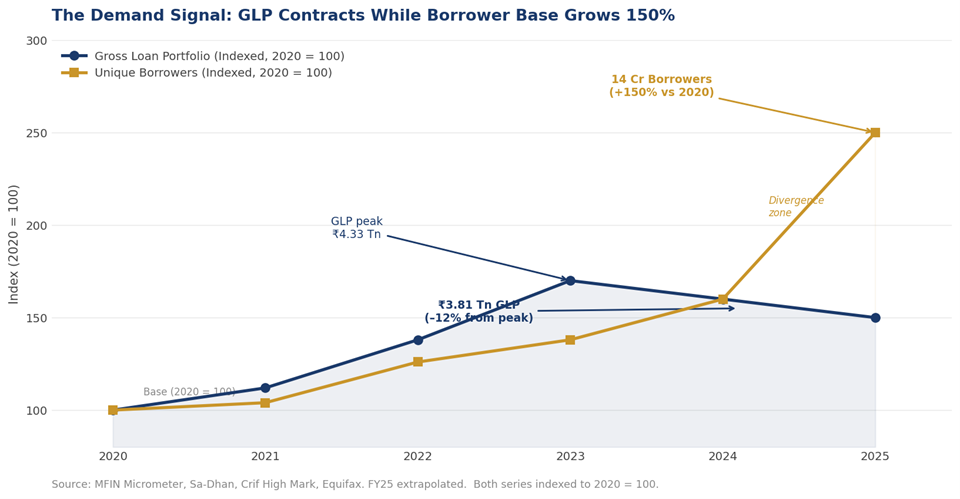
Exhibit 3: The Demand Signal: GLP Contracts While Borrower Base Grows 150%. Source: MFIN Micrometer, Sa-Dhan, Crif High Mark, Equifax. FY25 extrapolated.
Source: Arete sector model; MFIN; Sa-Dhan; CRIF MicroLend.
3. Renewable Energy
India’s 500 GW renewable energy target by 2030 implies a financing requirement the public sector balance sheet alone cannot meet. The distributed tier (rooftop solar, off-grid rural systems, and EV charging infrastructure) is where specialised NBFC lenders have a comparative advantage in asset-level underwriting. The addressable formal credit market in 2025 is estimated at ₹3.2 lakh crore, with a projected path to ₹5-7 lakh crore by 2030.
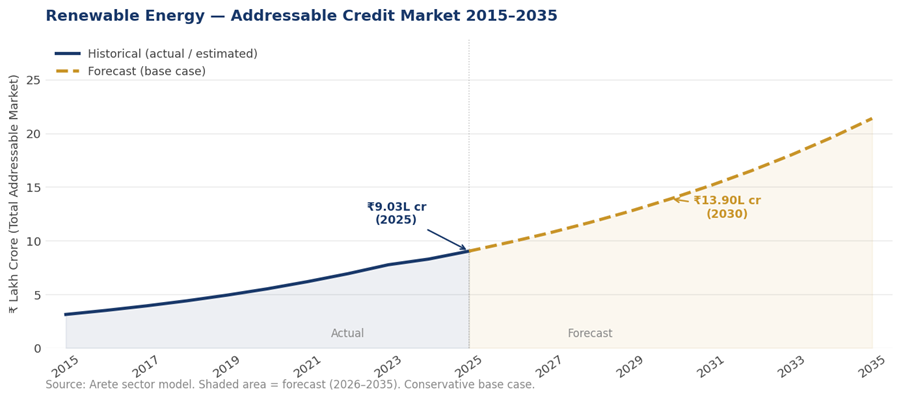
Exhibit 3: The Demand Signal: GLP Contracts While Borrower Base Grows 150%. Source: MFIN Micrometer, Sa-Dhan, Crif High Mark, Equifax. FY25 extrapolated.
Source: Arete sector model; MFIN; Sa-Dhan; CRIF MicroLend.
4. E-Mobility
Fleet electrification in commercial two- and three-wheeler categories has crossed the total-cost-of-ownership viability threshold. Purpose-built e-mobility lenders are beginning to serve fleet operators and driver-owners at ticket sizes and turnaround speeds that traditional bank credit functions cannot accommodate. The segment carries one of the highest forward growth rates in the group (estimated at 15% CAGR on a conservative base) with a path to ₹5-8 lakh crore by 2030.
Source: Arete sector model; Invest India; MHI FAME-II/PLI data; CEEW-CEF; Mordor Intelligence. Note: pre-2023 values are model estimates.
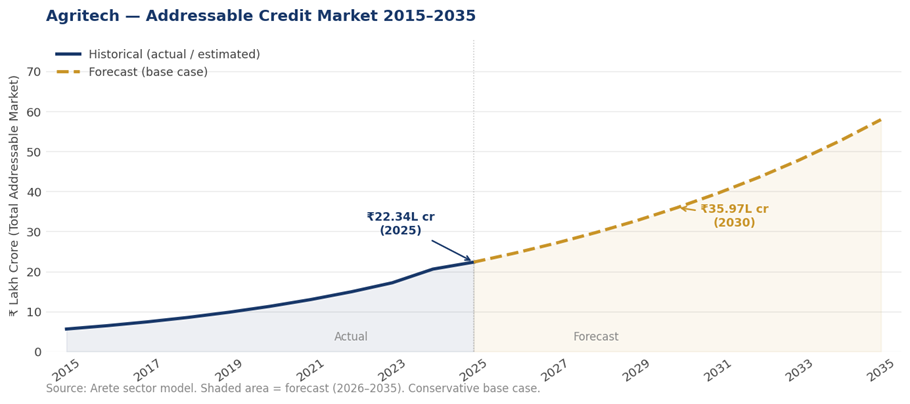
5. Agritech
Satellite-based crop monitoring, digital marketplace data from platforms such as eNAM, and supply chain visibility through ONDC are, for the first time, making agricultural credit assessment possible without the physical field presence that made small-ticket rural lending economically unviable for most formal lenders. NABARD’s Agriculture Infrastructure Fund has created demand signal in the sector. The addressable market is estimated at ₹8.4 lakh crore today, with a projected path to ₹15-8 lakh crore by 2030.
Source: Arete sector model; NABARD NAFIS 2.0 (2025); NABARD AIF data; Maple Advisors May 2025.
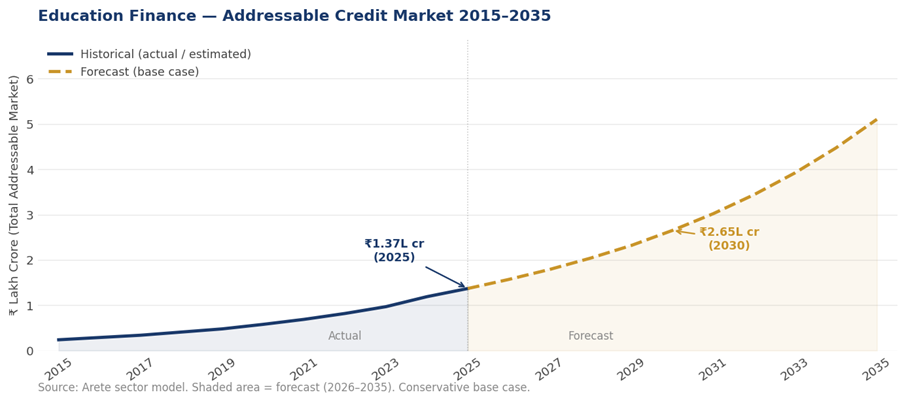
6. Education Finance
Education finance is growing with rising higher education enrolment and a fast-growing vocational and skill-based training market. Income-share agreement models are beginning to align lender and borrower incentives in ways the fixed repayment loan structure does not. At ₹1.1 lakh crore in 2025, it is the smallest sector in the group by formal supply but carries an estimated 14% forward CAGR with a projected path to ₹3-4 lakh crore by 2030.

Source: Arete sector model; Ministry of Education; IAMAI + Grant Thornton India EdTech Report; MarketResearchFuture.
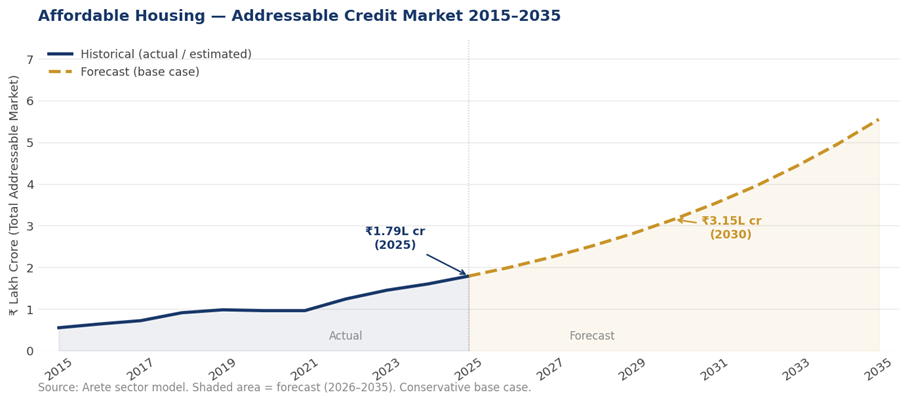
7. Affordable Housing
The documented housing deficit of nineteen million units, concentrated in secondary and tertiary cities where formal housing finance penetration is lowest, creates credit demand that is both large and durable. The PMAY credit-linked subsidy scheme has supported demand but not resolved the supply-side constraint. The addressable market is estimated at ₹12.2 lakh crore in 2025 with a projected path to ₹20-25 lakh crore by 2030.
Source: Arete sector model; NHB Annual Report 2024-25; PMAY-U/G progress reports; NHB Trend and Progress of Housing in India.
HOW THE CREDIT OPPORTUNITY IS FUNDED
Meeting the credit demand documented above requires not only origination capacity but a funding architecture capable of sustaining it at scale. At present, the bulk of formal credit supply in these segments is anchored in the domestic financial system. Banks remain the largest source, both through direct lending under priority sector mandates and indirectly through lending to NBFCs and specialised intermediaries. NBFCs have emerged as critical conduits of credit to underserved markets, drawing on a mix of bank borrowings, capital market instruments and securitisation structures to fund their portfolios.
Policy-led mechanisms have shaped the funding landscape alongside direct credit delivery. CGTMSE reduces lender risk in the MSME segment. Refinance institutions (SIDBI, NABARD and NHB) provide targeted liquidity to specific sectors. Development finance institutions and multilateral agencies have supported microfinance, renewable energy and affordable housing through long-tenor capital, risk-sharing facilities and technical assistance.
The wholesale fundable layer, i.e. the portion of total credit demand that reaches regulated NBFC intermediaries of sufficient scale and governance maturity to access institutional capital on commercially viable terms, is itself a large and growing market. Arete’s sector model estimates this layer at approximately ₹5.4 trillion (INR) as of 2025, growing to ₹14.1 trillion by 2035 under a conservative base case applying a 10% compound annual growth rate. This growth trajectory has sustained a 16% compound annual growth rate through demonetisation in 2016, the IL&FS contagion of 2018, the pandemic moratorium of 2020, and the sector correction of 2024-25. Each event contracted the book temporarily. None reversed the underlying trajectory.
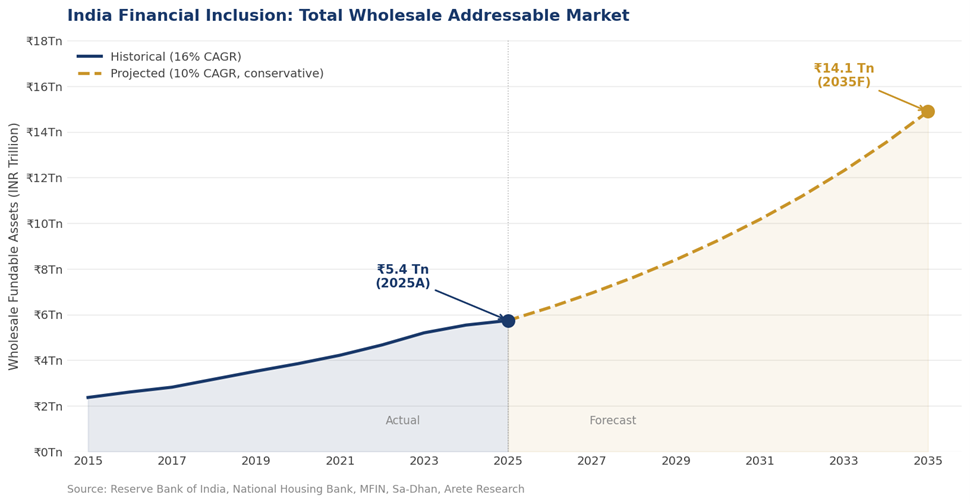
Exhibit 4: India Financial Inclusion: Total Wholesale Addressable Market, INR Trillion, 2015 Actual to 2035 Forecast. Source: Reserve Bank of India, National Housing Bank, MFIN, Sa-Dhan, Arete Research. Conservative base case applies 10% CAGR from 2025 base.
Looking ahead, the expansion of credit in these sectors will depend on how effectively the funding base deepens and diversifies. Continued policy support can further reduce risk and improve capital access. Market-based mechanisms such as securitisation can enhance liquidity and capital efficiency for originators. Blended finance structures and risk-sharing mechanisms can crowd in additional pools of capital not yet fully engaged. The evolution of funding sources is therefore not separate from the credit opportunity – it is a core part of how that opportunity will be realised.
CREDIT GAP BY SECTOR: THE SCALE OF REMAINING OPPORTUNITY
The table below sets out estimated credit demand, current formal supply, and the resulting gap across the seven sectors. These figures are calibrated to published sector data from the sources referenced in the methodology note.
Table 3: Estimated Credit Gap by Sector, 2025
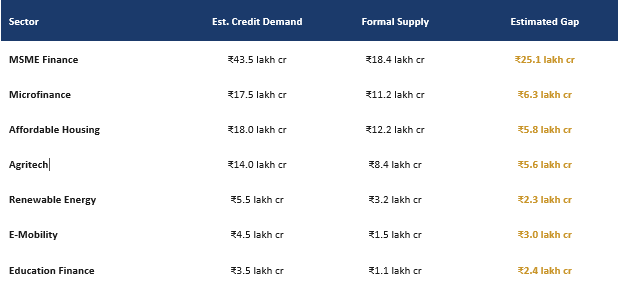
Sources: IFC–SIDBI MSME Finance Gap Assessment 2018, updated for formalisation trends; MFIN Micrometer Q4 FY2025; NHB Annual Report 2024–25; MNRE; Arete estimates. All figures indicative.
MSME finance accounts for by far the largest single component – ₹25.1 lakh crore of the estimated total gap. This reflects both the size of the sector and the fact that credit formalisation, while accelerating, is still in relatively early stages relative to the estimated enterprise population. The gap has not narrowed proportionally because addressable formal credit demand has itself grown as more enterprises enter the formal economy.
The sectors with the largest proportional gaps relative to estimated demand (e-mobility and education finance) are precisely those where formal credit infrastructure is newest. This reflects the lag between demand emergence and development of the lending infrastructure to serve it. That lag, and the forces beginning to close it in each sector, is what the deployment thesis in these segments is built around.
WHAT THIS MEANS FOR MARKET DEVELOPMENT
The analysis in this paper does not point to a single institutional solution. It points to the conditions under which coordinated participation by public institutions, private lenders and international capital can accelerate credit expansion across these seven sectors at the scale the opportunity warrants.
The past decade established the foundations. Public policy drove financial inclusion at scale through Jan Dhan, Aadhaar and UPI, while Mudra, CGTMSE and Priority Sector Lending directed capital toward underserved segments. Private sector institutions, particularly NBFCs and specialised lenders, built the operational and underwriting capabilities required to serve these markets. Development finance institutions and global capital providers supported sector development through risk capital and scaling of proven models.
Public institutions
Regulatory frameworks such as the RBI’s Scale-Based Regulation, co-lending guidelines and priority sector norms can continue to lower the cost of credit delivery and improve data access. First-loss mechanisms, credit guarantee structures and refinance facilities from SIDBI, NABARD, NHB and NaBFID can reduce risk at the margin where private capital has not yet arrived at scale. Continued build-out of digital public infrastructure (Account Aggregator, ONDC, GeM, OCEN) expands the information base on which new credit models are built.
Private lenders
NBFCs and specialised lending institutions can translate these enablers into scalable, sector-specific credit models. The shift to cash-flow-based underwriting in MSME finance, digital collections in microfinance, asset-backed structures in e-mobility, and supply chain finance in agritech are all examples of this translation already underway. As these models mature and credit performance data accumulates, the cost of capital for the institutions operating them should fall, expanding the addressable market further.
International participants
Development finance institutions, sovereign funds and impact-oriented institutional investors can support this expansion through long-tenor capital, risk-sharing mechanisms and knowledge transfer, particularly in early-stage or emerging segments where domestic capital markets have not yet priced the risk comfortably. The wholesale NBFC funding model offers a deployment architecture that matches the governance requirements of international capital with the origination reach of domestic lenders.
The gap between demand and supply in these sectors represents not a static constraint but a dynamic opportunity for system-wide coordination. Closing it will require continued evolution in credit infrastructure, institutional capacity and partnership models. The progress already made suggests that such coordination is both feasible and actively underway.
CONCLUSION
India’s financial deepening story is entering its second chapter. The first chapter, which ran from roughly 2014 to 2024, was about access: bringing people into the formal financial system through accounts, identity and payments infrastructure. That chapter is largely written, and it represents one of the most significant achievements in financial inclusion in any economy in any period.
The second chapter is about credit: building the lending infrastructure to serve the borrowers the formal system has reached but not yet financed. This paper has examined seven sectors where that gap is measurable, where the demand is demonstrably real, and where the forces generating it are structural and compounding.
The combined addressable credit opportunity across these sectors is approximately ₹60 lakh crore today and could reach ₹130 lakh crore by 2030. The wholesale fundable subset, accessible through regulated NBFC intermediaries at institutional scale, has grown at 16% per annum over the past decade through multiple disruptions and is projected to reach ₹14.1 trillion by 2035 on conservative assumptions.
The gap between what borrowers in these sectors need and what the formal credit system currently supplies represents an opportunity growing faster than the infrastructure to serve it. The constraint is the pace at which credit infrastructure built for the economics of small-ticket, sector-specialised lending can scale to match the demand that India’s financial inclusion drive has made visible. How that infrastructure is built, how it is funded, and what the economics of the wholesale lending model look like for participants across the public, private and international capital spectrum are questions this paper has set out to frame rather than resolve.
Further research. India’s NBFC funding markets have evolved significantly over the past decade, with the capital architecture supporting impact credit platforms becoming more diversified and institutionally mature. The economics of lending models that intermediate between large institutional capital and small borrowers in underserved sectors represent an area of active analytical development, and one where platform selection and credit infrastructure quality are as consequential as market size.
The past decade established the foundations. Public policy drove financial inclusion at scale through Jan Dhan, Aadhaar and UPI, while Mudra, CGTMSE and Priority Sector Lending directed capital toward underserved segments. Private sector institutions, particularly NBFCs and specialised lenders, built the operational and underwriting capabilities required to serve these markets. Development finance institutions and global capital providers supported sector development through risk capital and scaling of proven models.
REFERENCES AND DATA SOURCES
Regulatory and Government Sources
[1] Reserve Bank of India. (2025). Annual Report 2024-25. RBI, Mumbai.
[2] Reserve Bank of India. (2025). Report on Trend and Progress of Banking in India 2024-25. RBI, Mumbai.
[3] National Housing Bank. (2025). Annual Report 2024–25. NHB, New Delhi.
[4] Ministry of New and Renewable Energy. (2025). Annual Report 2024-25. MNRE, Government of India, New Delhi.
[5] NITI Aayog. (2024). Financial Inclusion in India: Progress, Challenges and the Road Ahead. NITI Aayog, New Delhi.
[6] NABARD. (2025). All India Rural Financial Inclusion Survey 2021-22 (NAFIS 2.0). NABARD, Mumbai.
Sector Reports and Market Data
[7] Microfinance Institutions Network. (2025). Micrometer: Quarterly Microfinance Sector Report, Q4 FY2025. MFIN, New Delhi.
[8] Sa-Dhan. (2025). The Bharat Microfinance Report 2025. Sa-Dhan, New Delhi.
[9] SIDBI. (2025). MSME Pulse Report Q4 FY2025. Small Industries Development Bank of India, Lucknow.
[10] International Finance Corporation and SIDBI. (2018). MSME Finance Gap: Assessment of the Shortfalls and Opportunities in Financing MSMEs in Emerging Markets. IFC, Washington D.C.
[11] World Bank Group. (2022). Global Financial Development Report 2022–23: Financial Inclusion. World Bank, Washington D.C.
[12] Government of India, Ministry of Finance. (2025). Pradhan Mantri Mudra Yojana (PMMY): Annual Report and Cumulative Disbursement Data 2024-25. Ministry of Finance, New Delhi.
Arete Research
[13] Arete Financial Partners. (2025). India Impact Credit Sector Model: Addressable Market Projections 2025-2030. Internal research document. Arete Financial Partners, Singapore.
[14] GST Council, Government of India. (2025). GST System Statistics: Active Taxpayer Registrations. Ministry of Finance, New Delhi.
RECOMMENDED CITATION
Arete Financial Partners. (2026). India’s Impact Credit Market: Size, Structural Gaps, and Growth Outlook. Financial Inclusion Practice Research Paper No. 1. Arete Financial Partners, Singapore.
METHODOLOGY NOTE
Regulatory and Government Sources
Market size and credit gap estimates are sourced from the Reserve Bank of India’s annual and quarterly publications [1][2], the National Housing Bank [3], MFIN’s quarterly Micrometer reports [7], the Sa-Dhan Annual Bharat Microfinance Report [8], SIDBI’s MSME Pulse [9] and the IFC-SIDBI MSME Finance Gap Assessment [10]. Credit-to-GDP comparisons draw on the World Bank Global Financial Development Database and BIS Credit Statistics; the measure used throughout is domestic credit to the private sector as defined by the World Bank GFDD, which excludes credit to the government sector.
Sector-level demand estimates are constructed as follows. MSME credit demand is anchored to the IFC-SIDBI finance gap assessment [10], updated for subsequent formalisation growth using SIDBI Pulse data [9] and Udyam registration statistics; the update accounts for GST adoption, TReDS and OCEN scale-up, and SFB sector growth since 2018. Affordable housing demand is derived from NHB credit penetration ratios applied to the documented nineteen million unit housing shortage. Renewable energy and e-mobility financing requirements are estimated from government capacity targets and prevailing project leverage ratios reported in MNRE publications [4]. Agritech and education finance are derived from rural credit penetration surveys [6] and sector capital formation trends. The wholesale fundable market series applies a 10% conservative compound annual growth rate from the 2025 base. All INR lakh crore figures are Arete estimates calibrated to published sector data. Detailed sector data tables, CAGR triangulation and individual segment series are presented in Appendix B.
DISCLAIMER
This paper has been prepared by Arete Financial Partners for informational and research purposes only and does not constitute investment advice, a solicitation to purchase or sell any securities or financial instruments, or an offer of any kind. Information contained herein has been obtained from sources believed to be reliable, but Arete Financial Partners makes no representation as to its accuracy or completeness. Projections and forecasts are inherently subject to uncertainty and actual results may differ materially from those presented. This document is intended for sophisticated institutional readers. Redistribution requires the prior written consent of Arete Financial Partners. For citation in research or policy documents, use the recommended citation above. Copyright 2026, Arete Financial Partners. All rights reserved.
APPENDIX B
Sector Data Tables 2015–2035
This appendix presents the underlying numerical data for all seven sectors in consolidated form. All values are in INR Lakh Crore. Italic values (2015-2022) are back-calculated from published actuals using reported historical CAGRs or are model proxies where no formal data series exists. Forecast values (2026-2035, lightly shaded) represent Arete’s conservative base case.
B.1 CAGR Assumptions by Segment
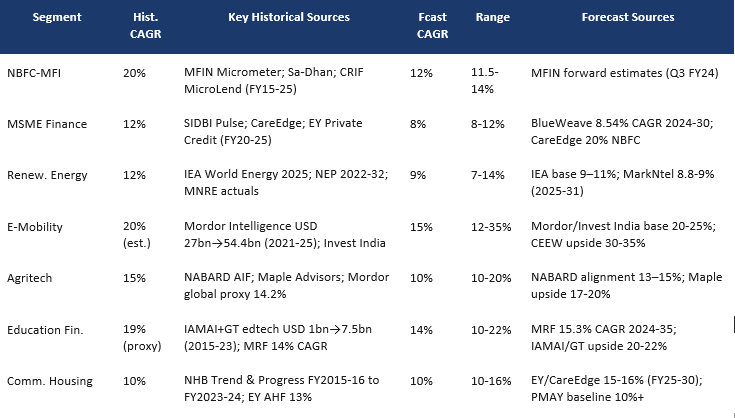
Sources as cited per segment. Model adopts conservative base case (lower bound of published range) for all forward projections.
B.2 Total Addressable Market - All Seven Sectors (₹ Lakh Crore)
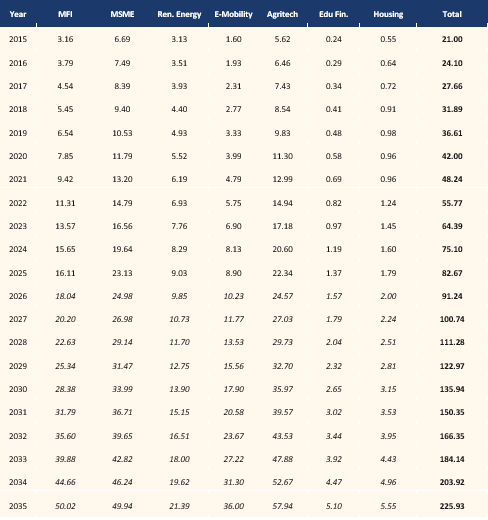
Source: Arete sector model calibrated to RBI, NHB, MFIN, SIDBI, MNRE, NABARD published data. Italic = estimated / model proxy. Shaded = forecast (2026-2035).
B.3 Wholesale NBFC Layer - All Seven Sectors (₹ Lakh Crore)
The wholesale NBFC layer represents the subset of total credit demand that flows through regulated NBFC intermediaries of sufficient scale and governance to access institutional capital. Expressed as a share of TAM: MFI ~8%; MSME ~12%; Renewable Energy ~8%; E-Mobility ~4%; Agritech ~6%; Education Finance ~12%; Community Housing ~32% (EWS/LIG share).
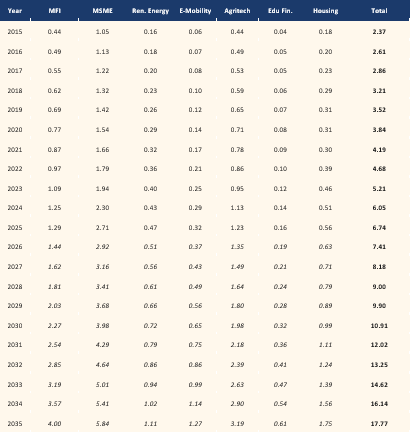
Source: Arete sector model. Wholesale layer shares: MFI 8%; MSME 12%; Renewable Energy 8%; E-Mobility 4%; Agritech 6%; Education Finance 12%; Community Housing 32% (EWS/LIG share per NHB/PMAY). Italic = estimated. Shaded = forecast.
Source Notes by Segment
[MFI] MFIN Micrometer Q4 FY2025; Sa-Dhan Bharat Microfinance Report 2025; CRIF MicroLend Quarterly (March 2025). 2023–25 actuals from MFIN/Sa-Dhan. 2015–22 back-calculated from FY2023 anchor at 20% CAGR.
[MSME] SIDBI MSME Pulse Q4 FY2025 (₹35.2 lakh Cr portfolio, March 2025); CareEdge MSME NBFC Outlook May 2025; IFC–SIDBI MSME Finance Gap Assessment 2018. 2015–22 back-calculated at 12% CAGR. Wholesale layer: ~12% of total per NBFC AUM share.
[Renewable Energy] MNRE Annual Report 2024–25; NEP 2022–32 capacity data; IEA World Energy Investment 2025; MoP/PIB Press Release Nov 2024. 2017–24 from NEP/MNRE actuals. 2015–16 back-calculated at 12% CAGR. Wholesale layer: 8% NBFC share per Arete model.
[E-Mobility] Invest India; Ministry of Heavy Industries (FAME-II, PLI Scheme via PIB); CEEW-CEF ‘Financing India’s Transition to EVs’; Mordor Intelligence India EV Market. No formal NBFC-level lending data 2015–2022; all historical values are model estimates on 20% market CAGR proxy.
[Agritech] NABARD NAFIS 2.0 (2025); NABARD Agriculture Infrastructure Fund data; Ministry of Agriculture RKVY-RAFTAAR grant data; Maple Advisors ‘Agritech in India: Investment Trends’ (May 2025); Mordor Intelligence Global Agritech Market. 2015–22 back-calculated at 15% CAGR.
[Education Finance] Ministry of Education (Samagra Shiksha, RUSA); Invest India/Digital India; IAMAI + Grant Thornton India EdTech Report; MarketResearchFuture India EdTech Market. No formal govt education credit series published; all values are model estimates using edtech market size as proxy for formal credit demand.
[Community Housing] NHB Trend and Progress of Housing in India reports (FY2015–16 to FY2023–24, published actuals); PIB 12 March 2025 (FY24 disbursements); PMAY-U and PMAY-G progress reports. EWS/LIG share of 39% applied per NHB and PMAY definitions. 2015–2024 values are NHB actuals; 2025 provisional. Wholesale layer = EWS/LIG disbursement series directly.
This appendix has been prepared by Arete Financial Partners for informational and research purposes only. Market size estimates and growth projections are Arete estimates calibrated to published sector data and are subject to revision. Copyright 2026, Arete Financial Partners. All rights reserved.